Uncover meaningful data insights with Playwaze analytics, but what are we really showing you?
What do we record?
We track search histories that visitors on Playwaze or via our Portals make.
Charts
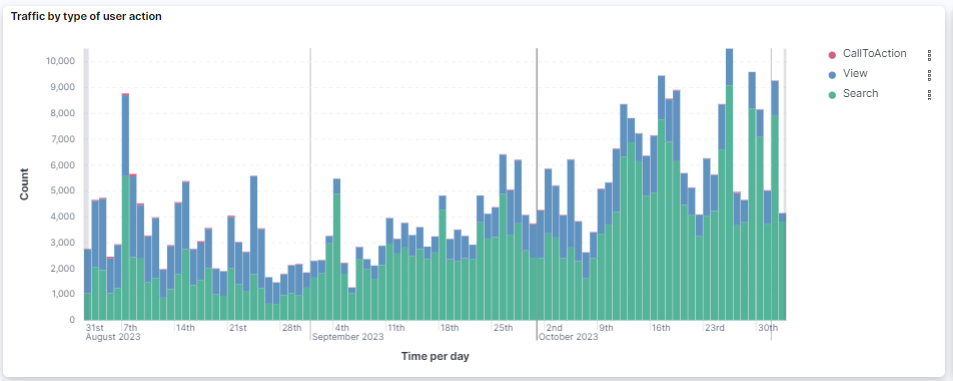
Traffic by type of user action - the number of visitor search actions, split by action types.
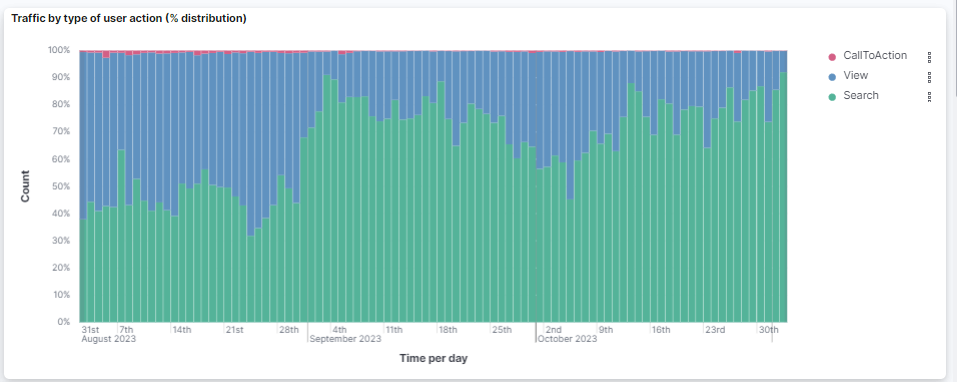
Traffic by type of user action (% distribution) - a breakdown of the types of visitor search actions, in percentage, from the total number of search actions.
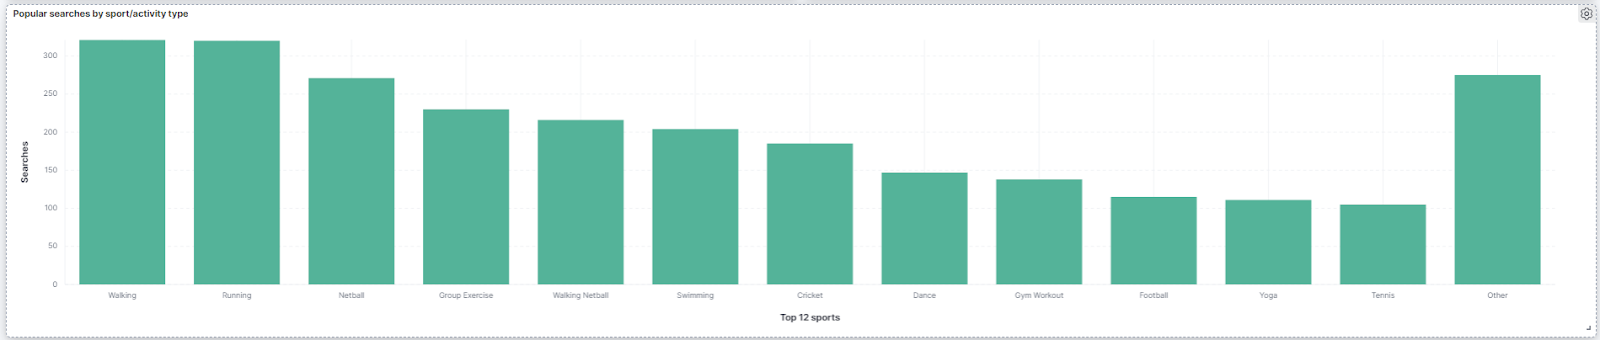
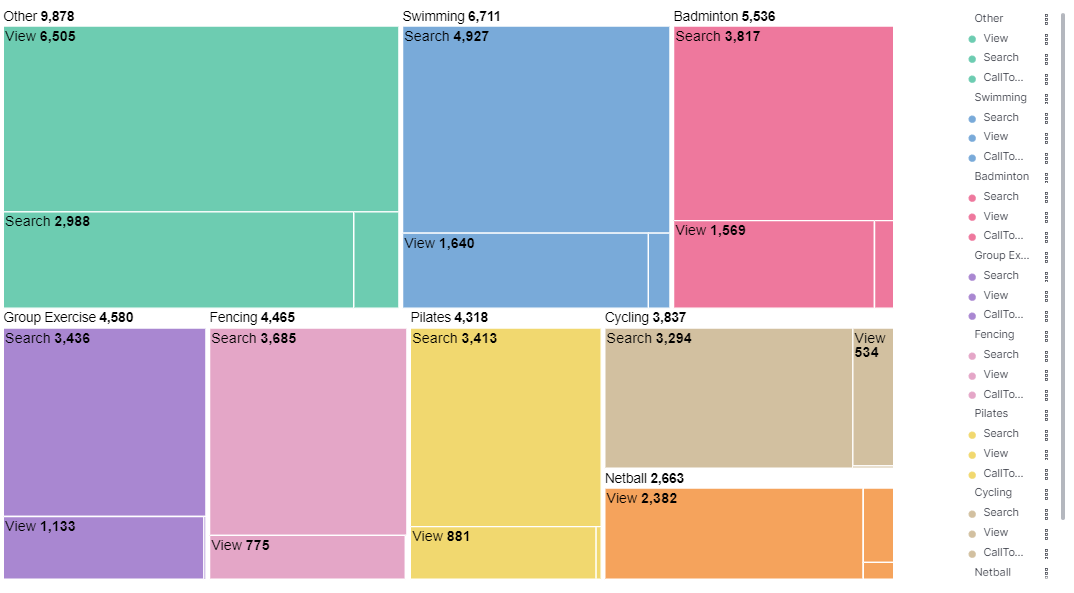
Popular searches by sport/activity type - the 12 most searched sport categories, split into 6 sport sub categories.
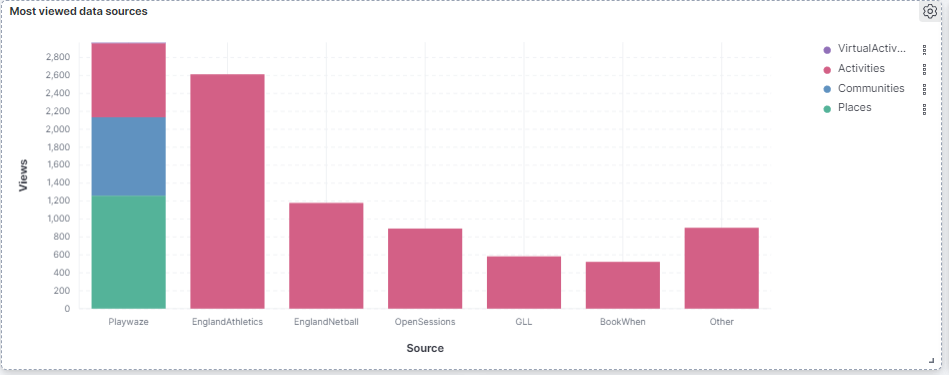
Most Viewed data sources - Shows the number of views for the top 6 data sources split by search result types.
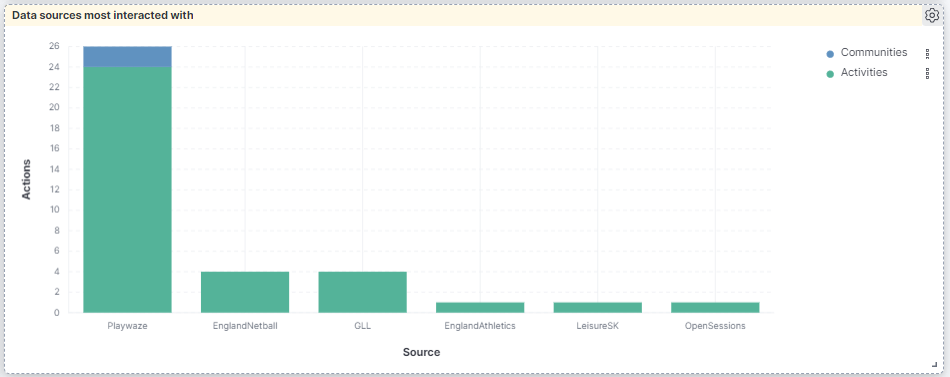
Data sources most interacted with - Shows the number of views and actions made for the top 6 data sources split by result types.
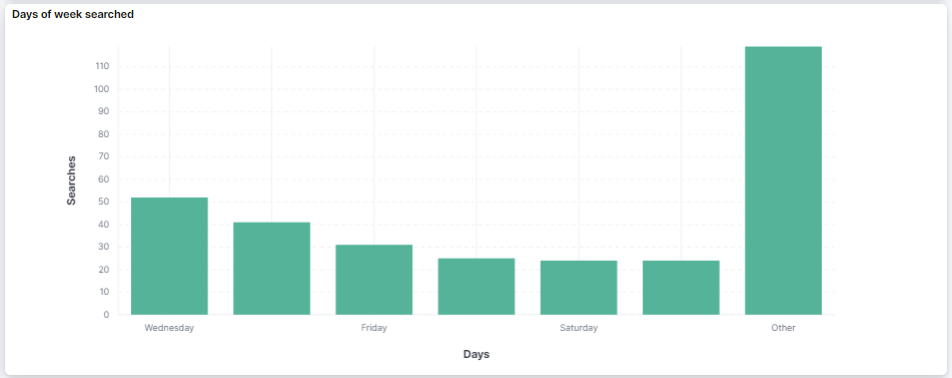
Days of week searched - Shows the most popular filters when searching. This includes filters for multiple days. If a user filters to multiple days i.e. Saturday and Sunday. The graph will increase the count of Saturday, Sunday.
Sports/activities with most interactions - Shows the 7 most interacted with sports, split by action types.
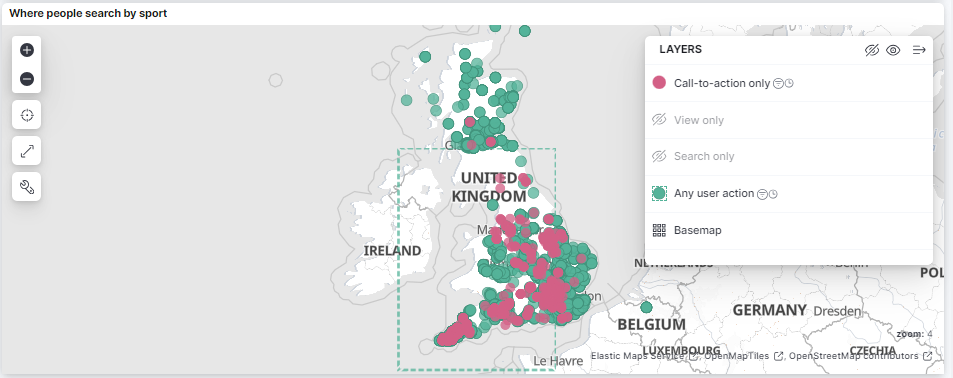
Where people search by sport - This shows the location of where people have searched for sports, broken down into the different search action types. The “Any user action” point on the map shows all action types (searches, views or calls to action).
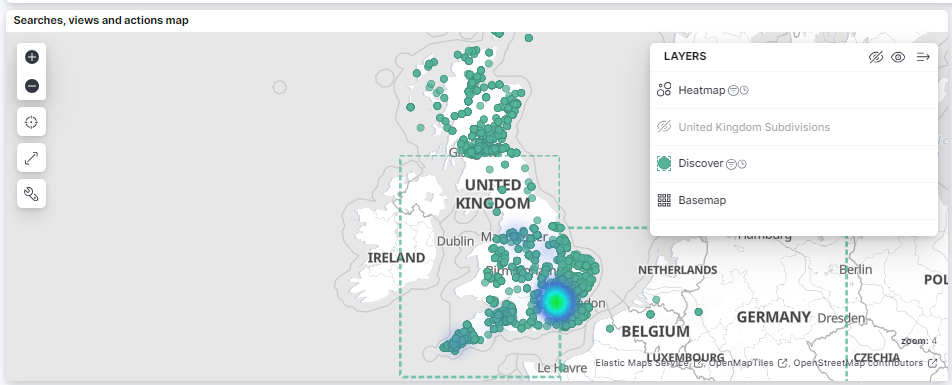
Searches, views and actions map - This shows all the locations where searches were made on the map, and also shows a heatmap of these searches.
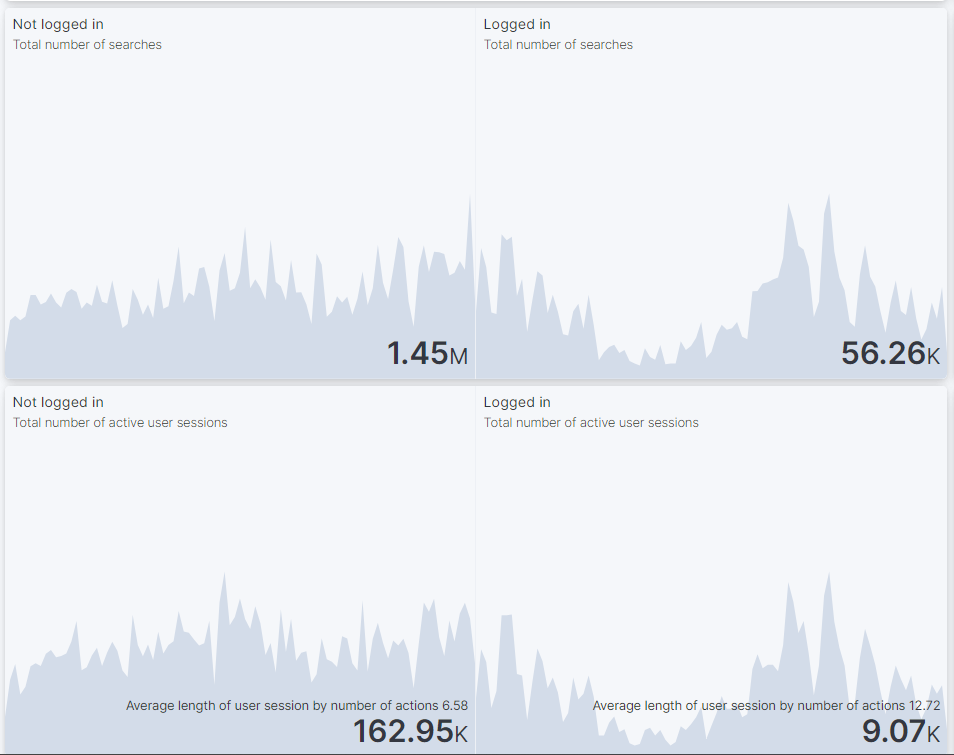
Anonymous + logged-in searches - shows searches and active sessions, both of which are then broken down into logged-in and not logged-in users.
An active session is determined by the user’s location, if two users are searching using the same wifi, they will be counted on the same active session.
The number above the bold number shows how many actions on average the users took before finishing the session (leaving for more than 30 minutes).
Average activity per user - the average number of views, searches and actions per user before finishing the session (leaving for more than 30 minutes).

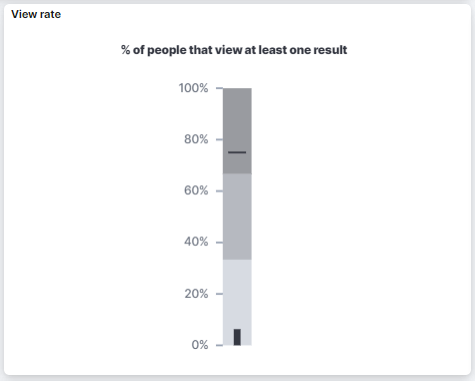
View rate - This is the percentage of users that during an active session have clicked on at least one activity to view.
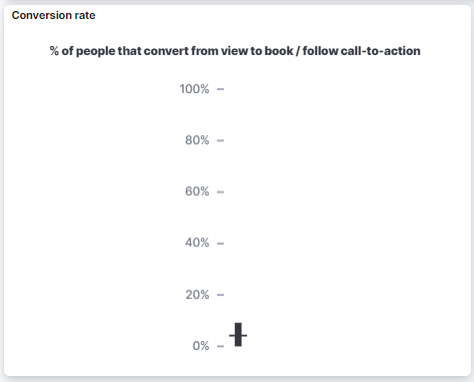
Conversion rate - The percentage of users that during an active session have at least once clicked on the book button for an activity.
Total number of interactions - Shows the total number of Searches, Views, Actions.
We know that analytic data can be very powerful, if you have any questions we haven't answered please reach out to support@playwaze.com and we'll be happy to help. 📧